> For the complete documentation index, see [llms.txt](https://support.happydemics.com/llms.txt). Markdown versions of documentation pages are available by appending `.md` to page URLs; this page is available as [Markdown](https://support.happydemics.com/analysis/brand-lift-results/data-enrichment/reading-your-brand-lift-results-by-exposure-location.md).
# Reading your Brand Lift results by exposure location
**Exposure location** lets you analyze your Brand Lift results according to where respondents were exposed to your campaign.
Two geographic levels can be available:
* **Region**
* **City**
This view can help you understand how campaign delivery and performance vary geographically. Location information comes from your campaign's delivery data and is linked individually to each respondent.
To understand how this matching works and the reliability rules applied to the data, see *How we link survey respondents to your campaign delivery*.
### Availability
Exposure location is:
* available **post-campaign only**
* enabled **automatically** when your campaign is measured with a retargeting pixel
* available at **region and city level**, depending on the sample available
No additional request or setup is required.
{% hint style="warning" %}
The view does not appear while your campaign is running in **in-flight** mode.
{% endhint %}
### Where can I find it?
In your Brand Lift, go to the **Delivery data** **tab and click on the Location tab**.
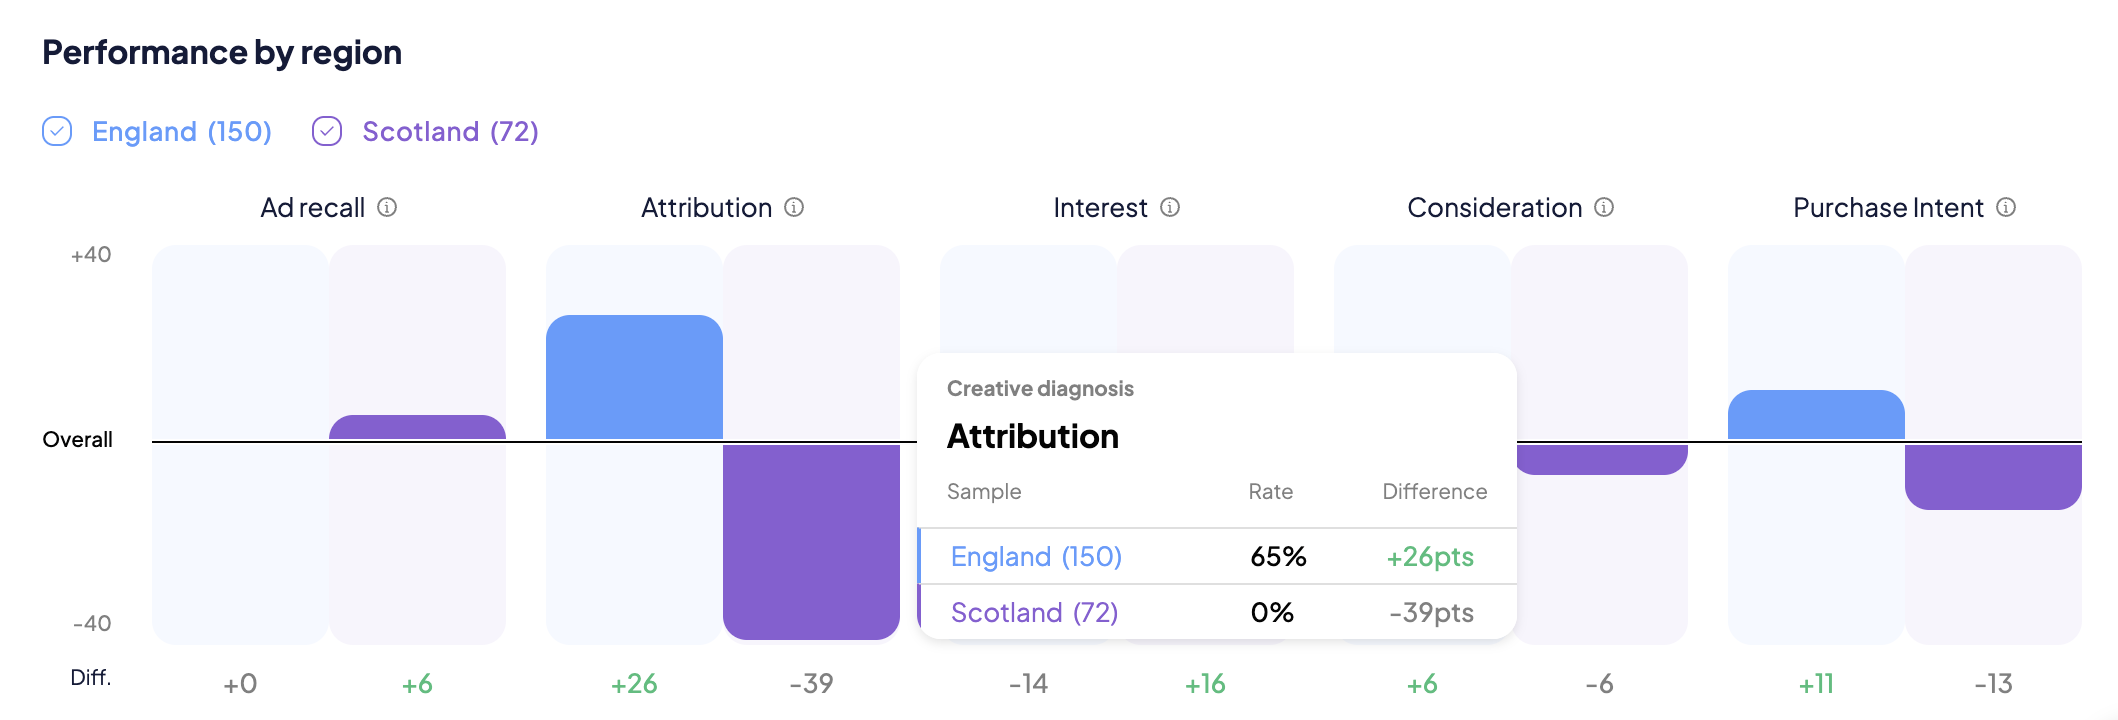
The **Score by KPI** chart compares the performance of each geographic area with the campaign's overall KPI score.
For each area:
* the bar shows its difference from the **Overall** score
* the **Diff.** value gives you the exact difference
* a significance indicator helps you identify differences that are statistically meaningful
You can also export the data using the **Download** button.
### Where does the location information come from?
Exposure location is based on the geographic information **passed by the DSP at impression time**.
It therefore describes the location associated with campaign delivery and does not come from information declared by the respondent in the survey.
### How are geographic areas displayed?
The geographic breakdown is created dynamically for each campaign.
We aim to show the **most granular level supported by the available sample.** Areas with fewer than 5 exposed ad recallers are not displayed.
For example, a campaign with sufficient respondents across multiple cities may provide a detailed city-level analysis. With a smaller sample, results may only be available at region level.
There is **no predefined maximum number of areas**: every eligible area that meets the minimum sample threshold can appear in the report.
{% hint style="warning" %}
In the reports, we don't display regions with less than 50 exposed ad recallers to keep only relevant data.
{% endhint %}
### How should I read the results?
The KPI scores within each area are calculated using the same methodology as the overall results of your Brand Lift study.
For **Impact KPIs**, results are expressed as **uplift**: the difference between ad recall respondents and the control group.
For **Creative Diagnosis KPIs**, results are expressed as an **absolute score among ad recall respondents**.
In the chart:
* A bar **above** the Overall line means that the area performed above the campaign average.
* A bar **below** the Overall line means that it performed below the campaign average.
The **Diff.** value shows the exact size of the difference.\
### Pay attention to significance
A **significance indicator** is available for each geographic area.
This helps you distinguish meaningful differences from variations that may simply be caused by the sample. When comparing locations, give more weight to differences that are statistically significant.
### What can I learn from this view?
Exposure location can help you:
* check how your campaign was distributed geographically
* compare Brand Lift performance across regions or cities
* identify areas where the campaign generated stronger or weaker results
* inform geographic targeting and budget allocation for future campaigns
### Keep in mind
Differences between areas **are not necessarily caused by media delivery alone**. Markets can differ in many ways before your campaign starts, for example in brand familiarity, competitive context or consumer behavior.
A stronger result in one location should therefore not automatically be interpreted as evidence that the media strategy was more effective there. Use exposure location alongside your market context, campaign setup and other Brand Lift results to build a more complete interpretation.
\
\
👋 If you don't find your answer, feel free to reach out to **** for further consideration.